Go 语言内置库里就自带了性能分析库 pprof。pprof 有两个包用来分析程序: runtime/pprof 与 net/http/pprof,其中 net/http/pprof 只是对 runtime/pprof 包进行封装并用 http 暴露出来。runtime/pprof 用于对普通的应用程序进行性能分析,主要用于可结束的代码块,比如一次函数调用;而 net/http/pprof 专门用于对后台服务型程序的性能采集与分析。
runtime/pprof 代码块
|
|
go build -o main main.go 构建程序
./main -cpu -mem 执行之后在当前文件夹生成main-cpu.prof, main-mem.prof文件
分析数据
浏览器(推荐)
go tool pprof -http=:端口号 生成的分析文件
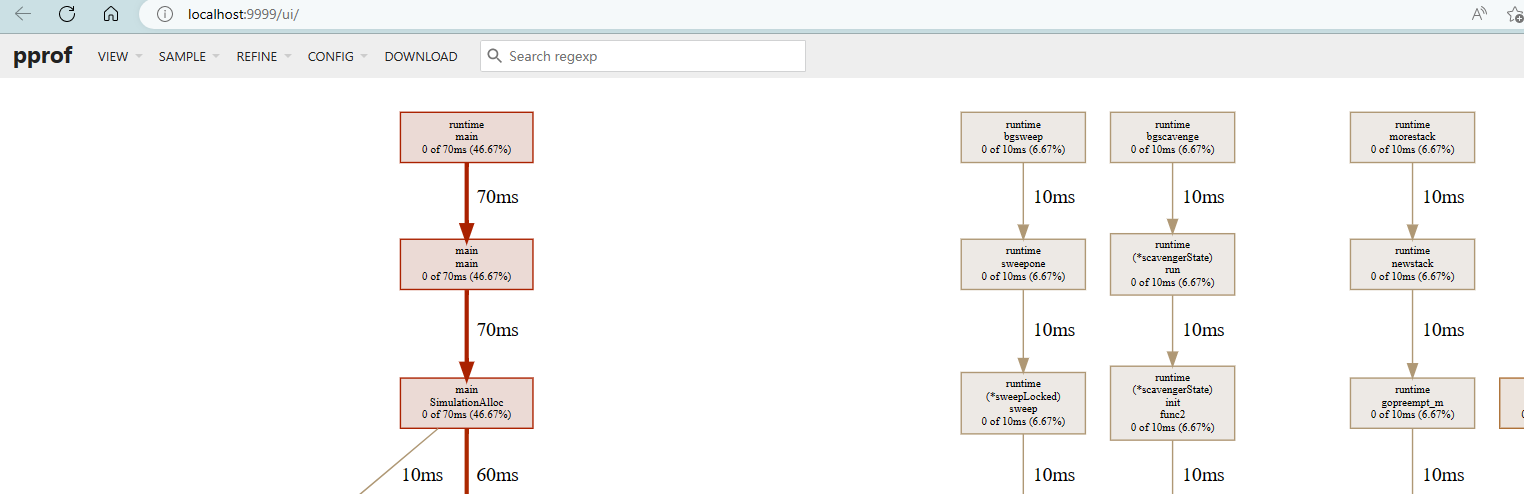
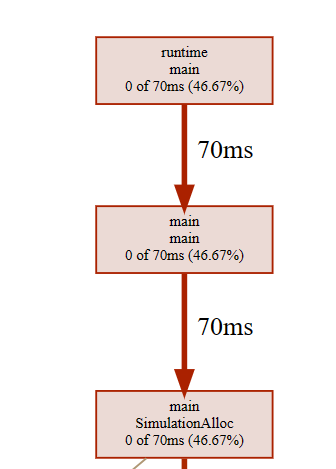
界面视图
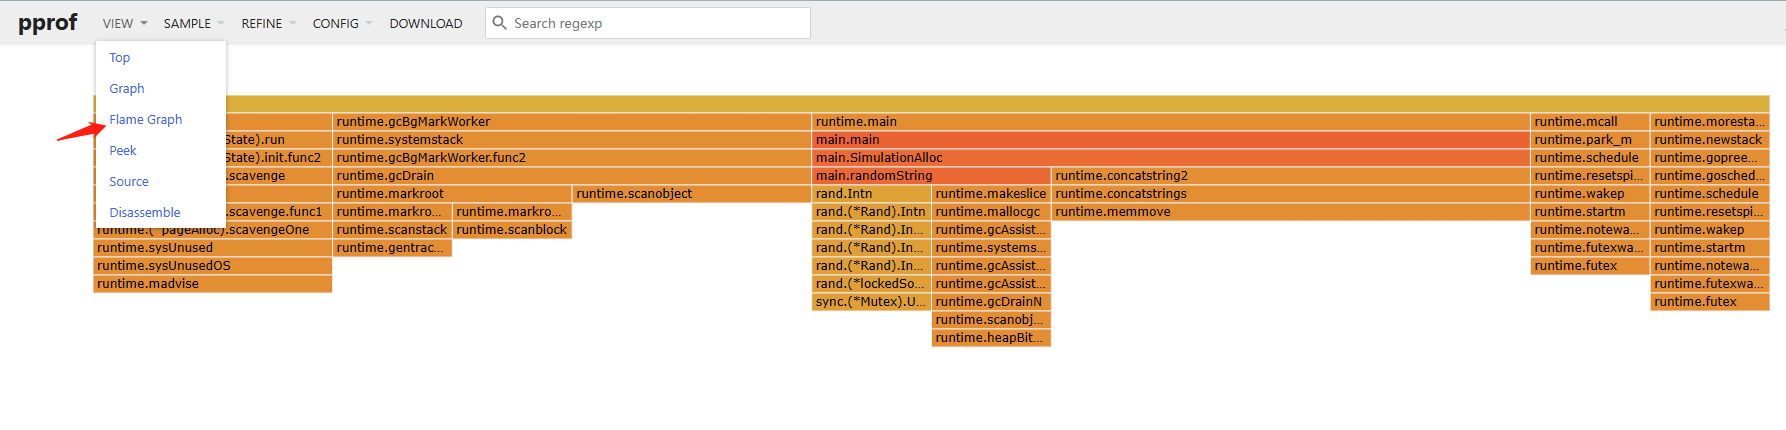
 火焰图视图
分析耗时的方法名
火焰图视图
分析耗时的方法名
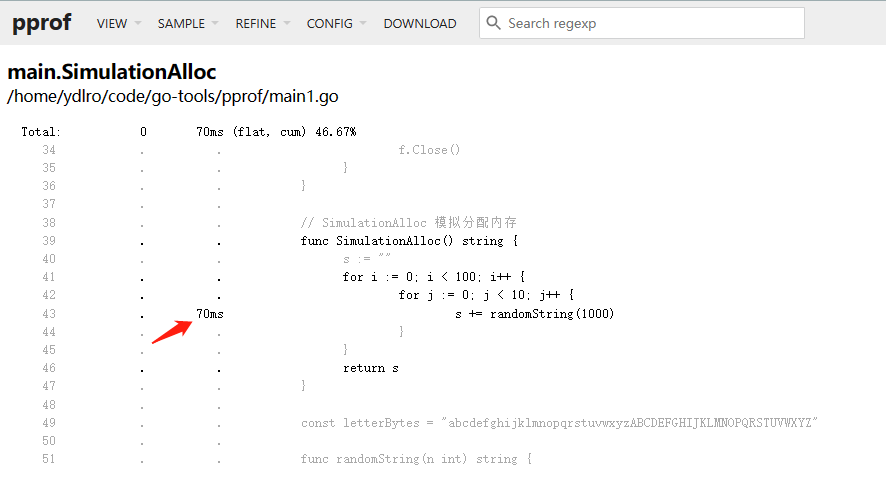
 源码视图
可以查看到43行耗时的代码
源码视图
可以查看到43行耗时的代码
cpu分析
go tool pprof -http=:9999 main-cpu.prof 浏览器打开cpu分析文件, 箭头线上的数字代表执行耗时
cpu分析文件部分截图
mem分析
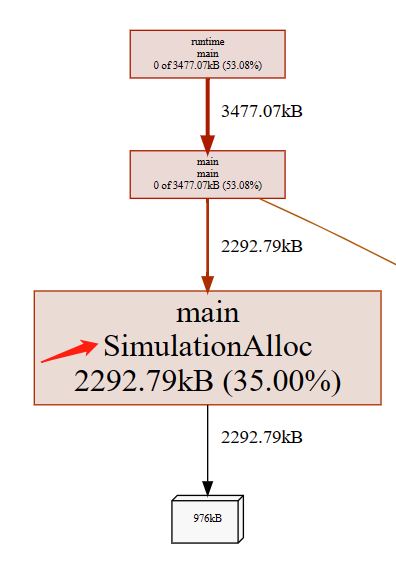
go tool pprof -http=:9998 main-mem.prof 浏览器打开mem分析文件, 箭头线上的数字代表分配内存
mem分析文件部分截图
终端命令
go tool pprof main main-cpu.prof
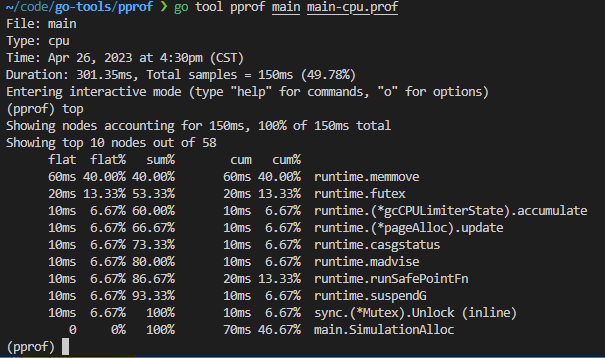
上图中,其他的一些参数解释如下:
- Duration:程序执行时间。多核执行程序,总计耗时 301.35ms,而采样时间为 150ms,假设有3核执-行该程序,则平均每个核采样50ms数据。
- flat/flat%:分别表示在当前层级cpu的占用时间和百分比。例如runtime.memmove在当前层级占用cpu时间60ms,占比本次采集时间的40%。
- cum/cum%:分别表示截止到当前层级累积的cpu时间和占比。例如main.SimulationAlloc累积占用时间70ms,占本次采集时间的46.67%。
- sum%:所有层级的 CPU 时间累积占用,从小到大一直累积到100%,即150ms.
- (pprof):命令行提示, 使用help查看更多。表示当前在go tool 的pprof工具命令行中, go tool还包括cgo、doc、pprof、test2json、trace等多种命令
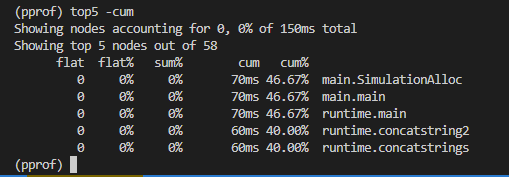
top5 -cum 按cum条件列出前5个,可以发现途中main.SimulationAlloc占用最多
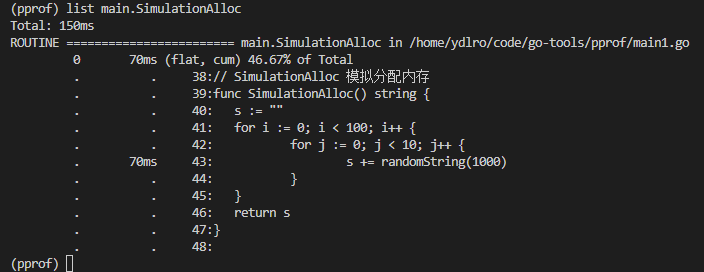
list main.SimulationAlloc 可以查看源码和执行信息,可以查看得知代码在43行耗时最多
net/http/pprof 分析web服务
|
|
运行程序,分析结果
|
|
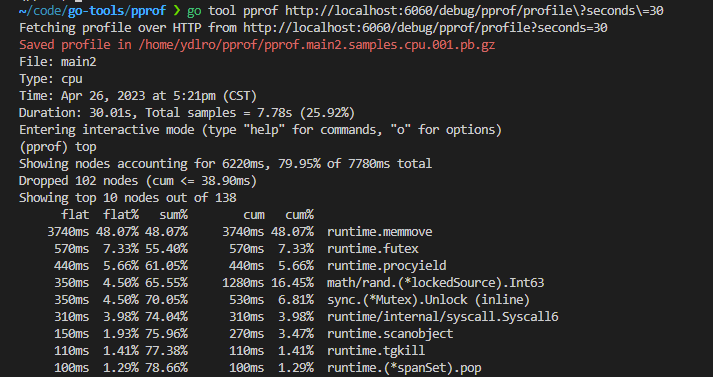
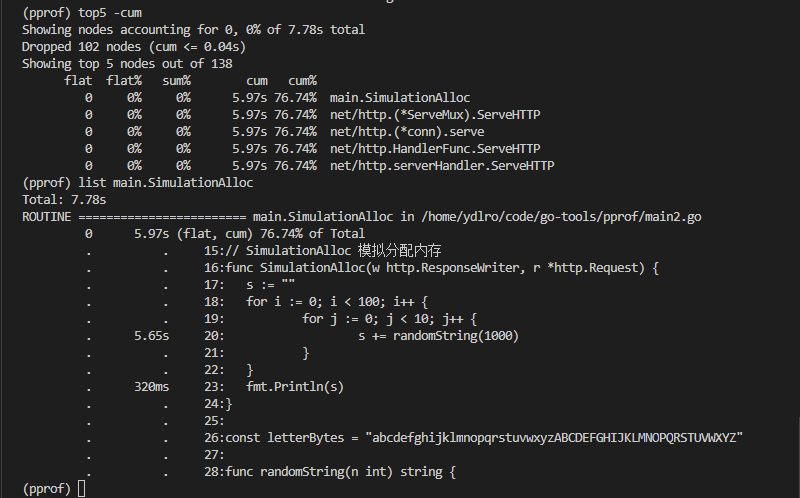
执行top5 -cum 查看耗时方法
执行list main.SimulationAlloc 定位耗时方法,处于第20行的代码
也可以通过执行svg在当前文件下生成svg文件或使用web,使用浏览器打开查看
因为web服务没有创建分析文件,需要执行go tool pprof http://localhost:6060/debug/pprof/profile\?seconds\=10 -output 同时执行wrk -c 10 -t 2 -d 10s http://localhost:6060/ 发起请求,收集数据分析,生成的文件自动Saved
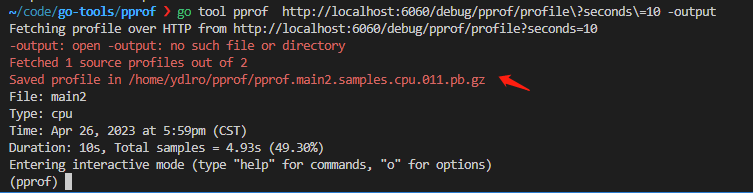 执行
执行go tool pprof -http=:9999 xxxx.pb.gz在浏览器打开分析数据(火焰图, 图表等)
更多操作, 参考:https://pkg.go.dev/net/http/pprof#hdr-Usage_examples 使用 pprof 工具查看堆剖析:
go tool pprof http://localhost:6060/debug/pprof/heap
如果要查看 30 秒的 CPU 剖析:
go tool pprof http://localhost:6060/debug/pprof/profile?seconds=30
如果要查看 goroutine 阻塞情况的剖析,在程序中调用 runtime.SetBlockProfileRate 后:
go tool pprof http://localhost:6060/debug/pprof/block
如果要查看互斥锁争用的持有者,在程序中调用 runtime.SetMutexProfileFraction 后:
go tool pprof http://localhost:6060/debug/pprof/mutex
该包还导出一个处理程序,为 “go tool trace” 命令提供执行跟踪数据。要收集 5 秒钟的执行跟踪:
curl -o trace.out http://localhost:6060/debug/pprof/trace?seconds=5
go tool trace trace.out
总结
例子:使用go-callvis 执行go代码,获取程序调用链,加载过程中出现比较慢的情况,需要对go-callvis进行分析,分析性能瓶颈
Trace
参考:https://tonybai.com/2021/06/28/understand-go-execution-tracer-by-example/